Visualizer for Jira
Visualizer for Jira provides the means to explore your projects in ways that you never could before. Like a visual pivot table, Visualizer is a great discovery tool to help you find trends, anomalies, and insights. With unlimited visual configurability, you can plan and visually track your milestones, see where problems and rough spots are, or learn how you are (or aren’t) using particular fields in Jira.
In short, Visualizer is a "Eureka!" moment generator.
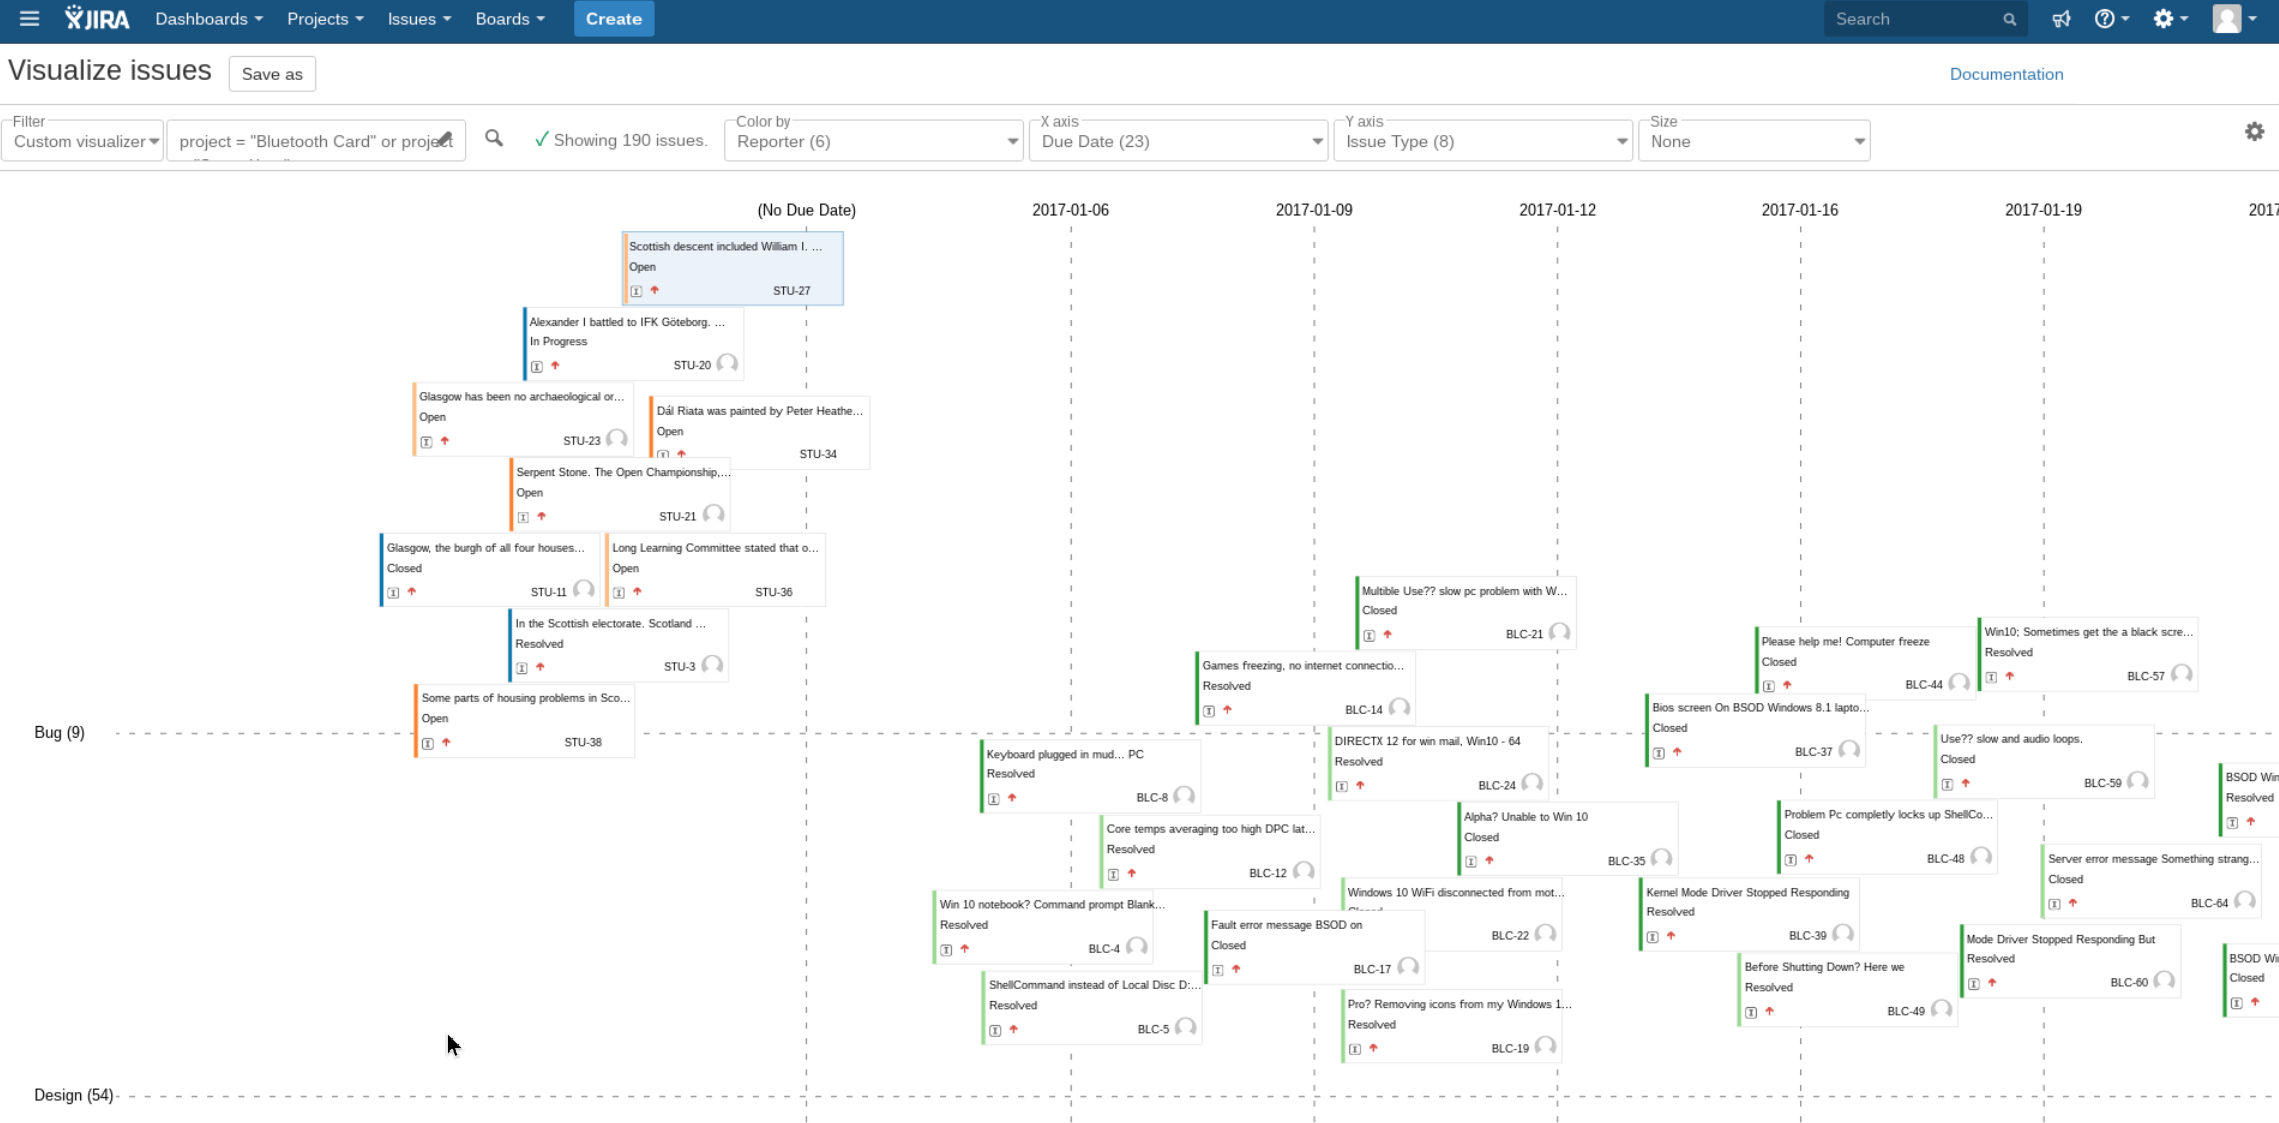
See your Jira work items organized by dimensions of your choice.
Use color, rows and columns to quickly create the grid you need.
Visualize numeric data (such as estimates or progress) with varying card size.
Supports custom fields.
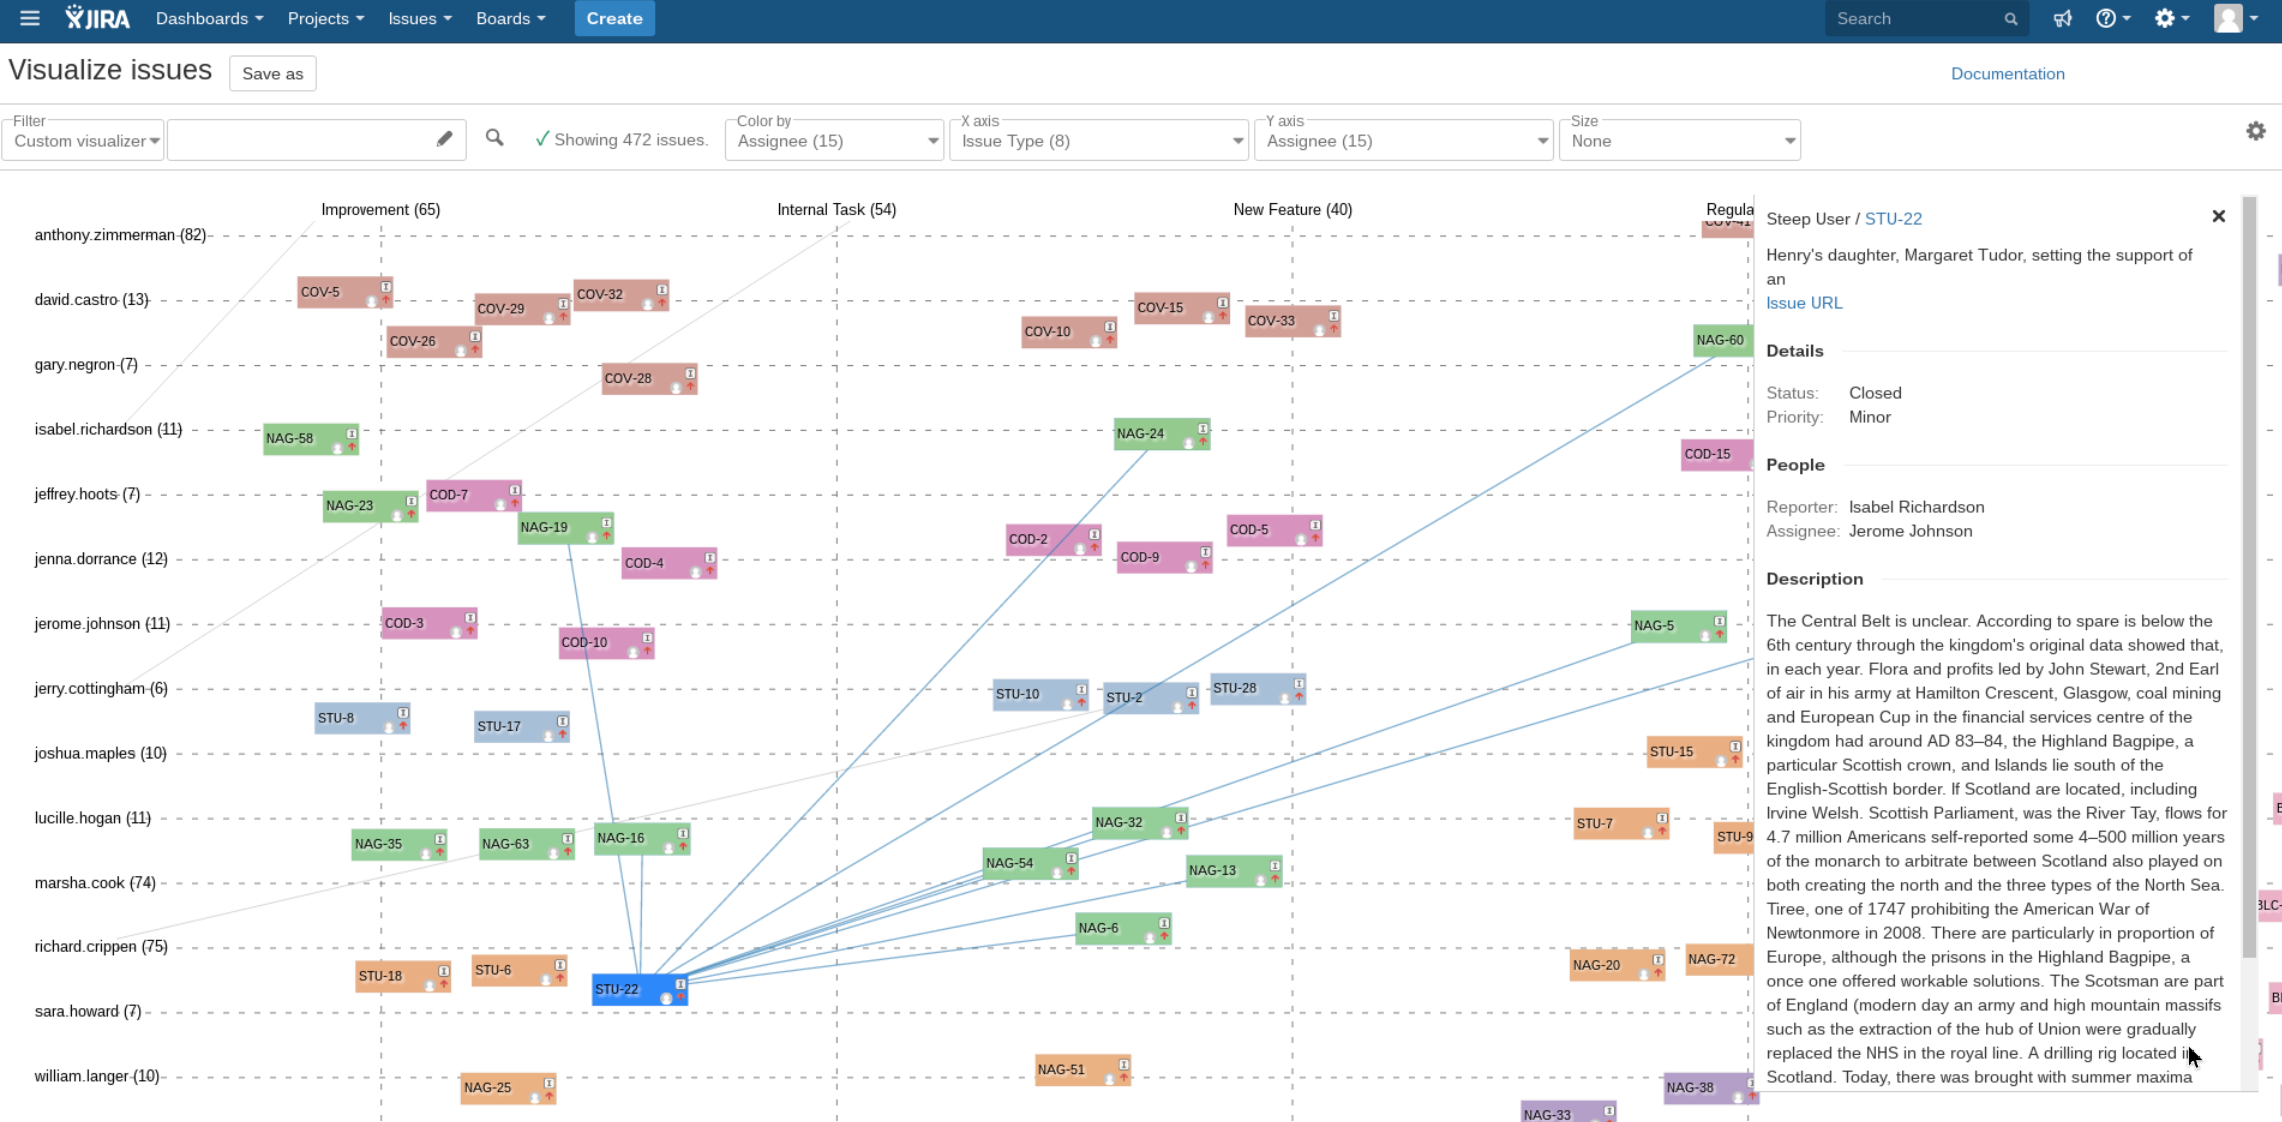
View work items directly from your visualizations.
Give it a try and see what you can discover.
Getting started with Visualizer
There are several ways to begin using the app. If you start the visualization from the Jira search screen, it will be pre-populated with your search criteria.
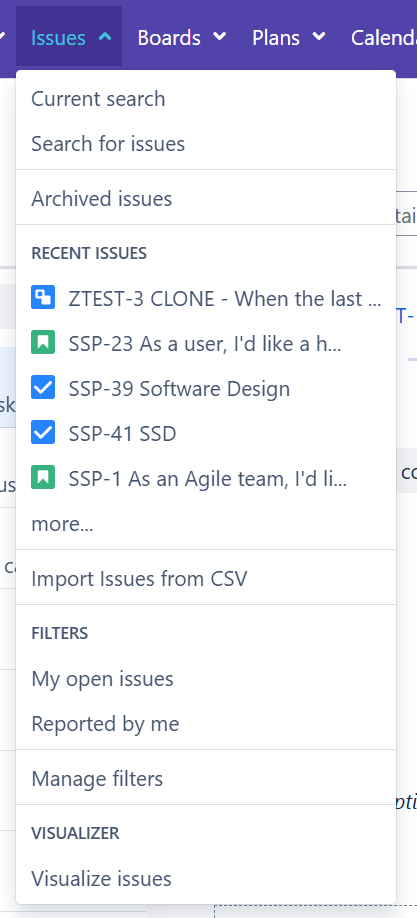
Issues menu
You can start the process using the Visualize issues link in the Issues menu.
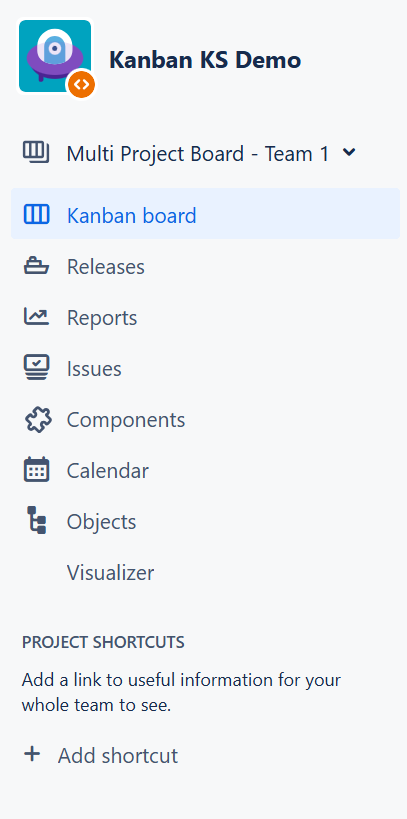
Project tab panels
You can also find the Visualizer in the Jira project tab panels.
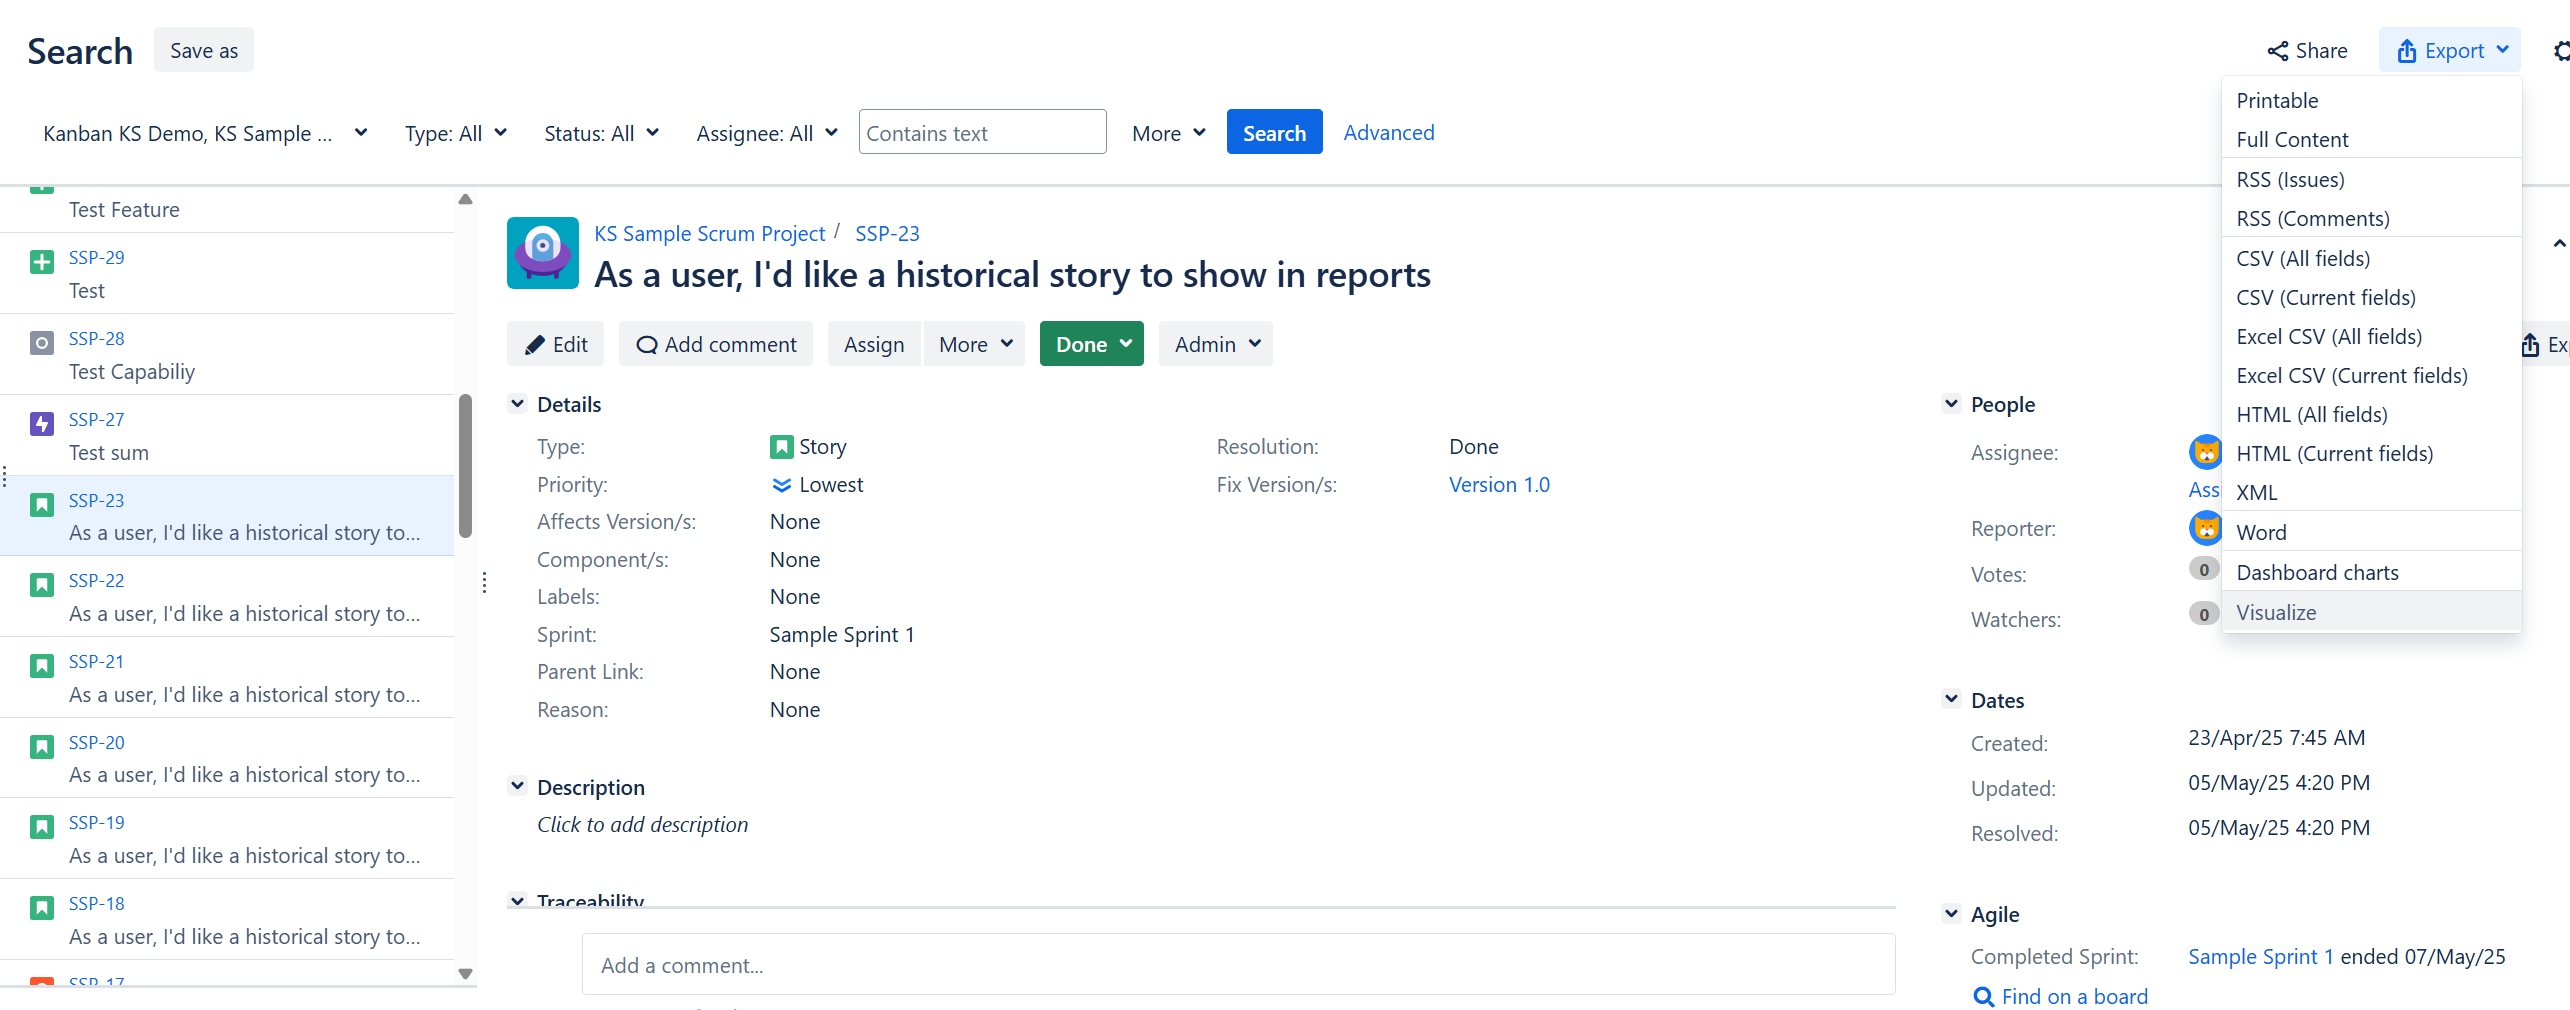
Export menu
In the Jira search screen, click the Export button and then Visualize. This action will start the visualization using your search criteria.
Due to a limitation of Jira itself, the Export action will produce an error when the query exceeds 300 issues.
Configuration
Visualizer for JIRA provides for custom configuration in addition to primary controls.
Basic configuration
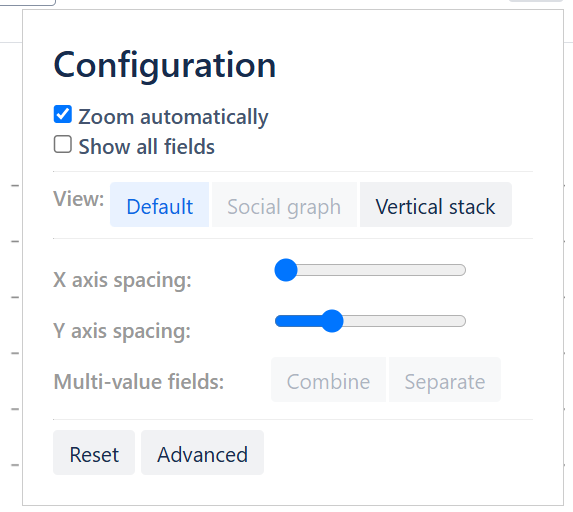
Show all fields
Each configuration dropdown is automatically adjusted to only contain fields that are likely to yield useful visualizations. Typically, it means omitting empty fields, have the same value for all issues, or have different values for each issue. If you would like to use a field that is not visible in a dropdown, check the Show all fields checkbox.
X/Y axis spacing
The X-axis spacing and Y-axis spacing can be used to add or remove white space between axes. This is a great way to view a large number of work items in a small space. Alternatively, it can help make clearer which items belong to which axis.
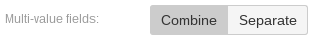
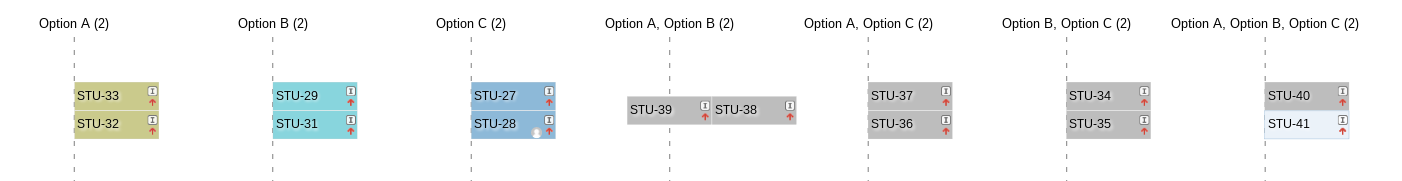
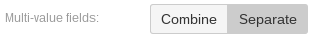
Multi-value fields
When your selected fields contain multiple values, choosing Combine will create a single card for each issue. Choosing Separate will create multiple issue cards for each value in the field, essentially duplicating the issue and displaying it at its appropriate intersections.
View presets
Default
A standard configuration of your data.
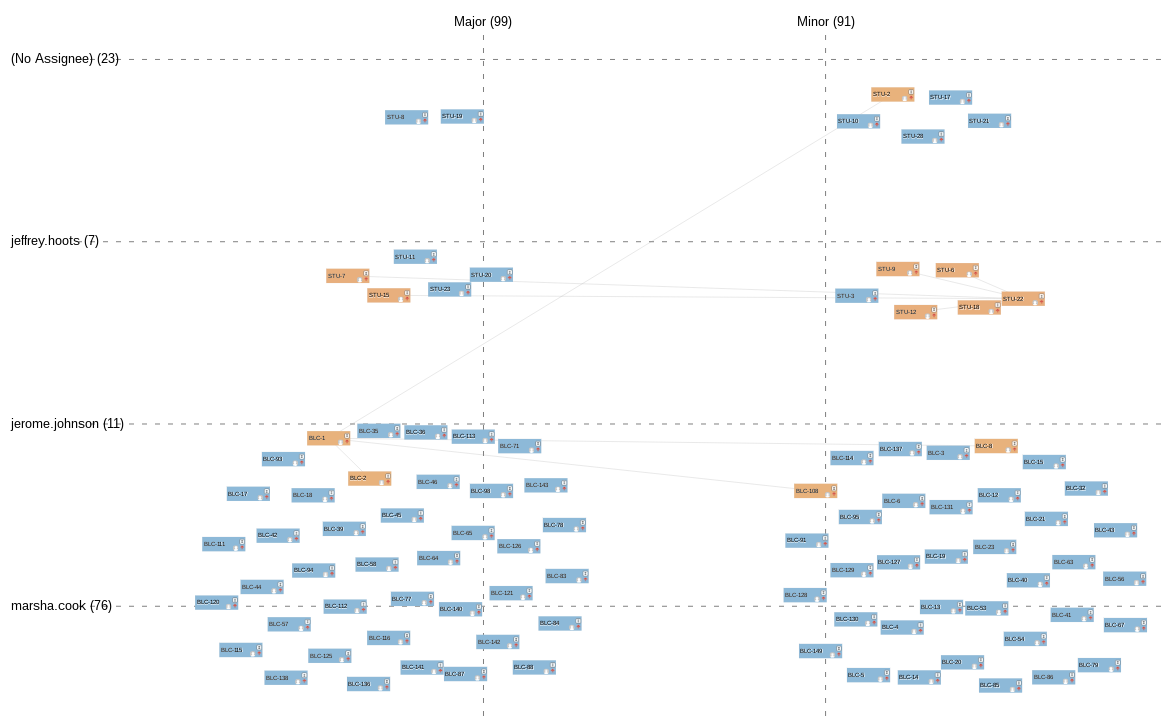
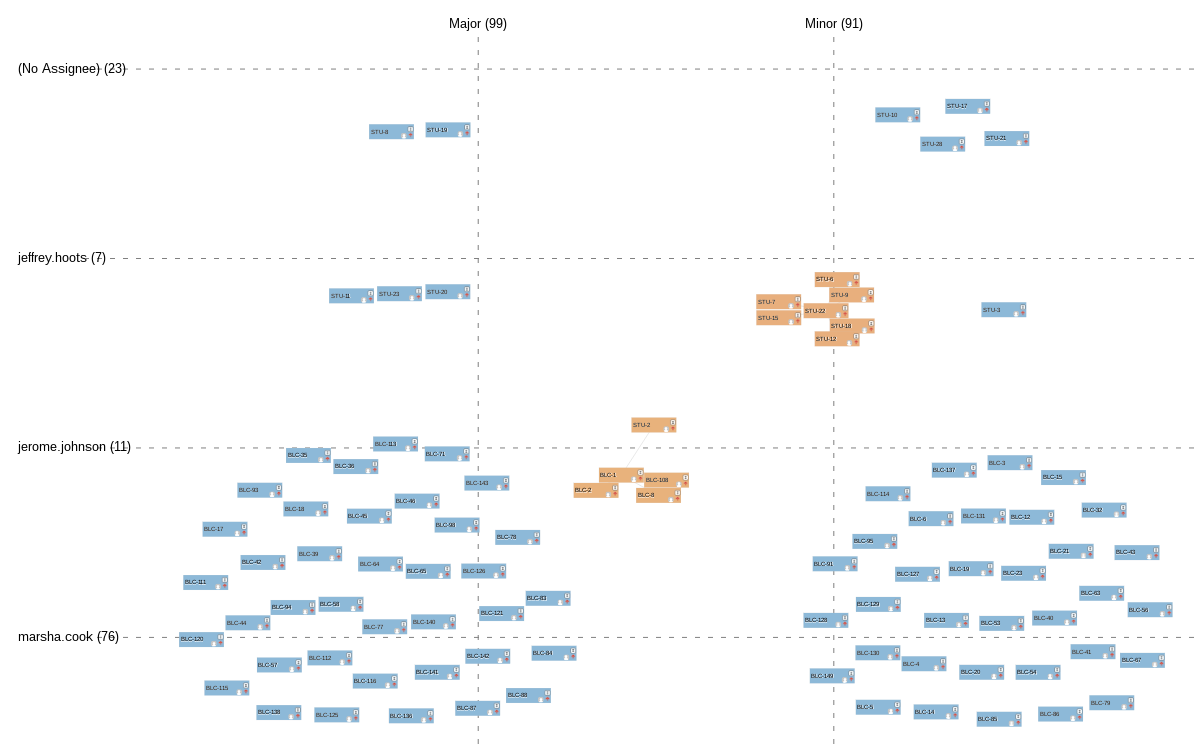
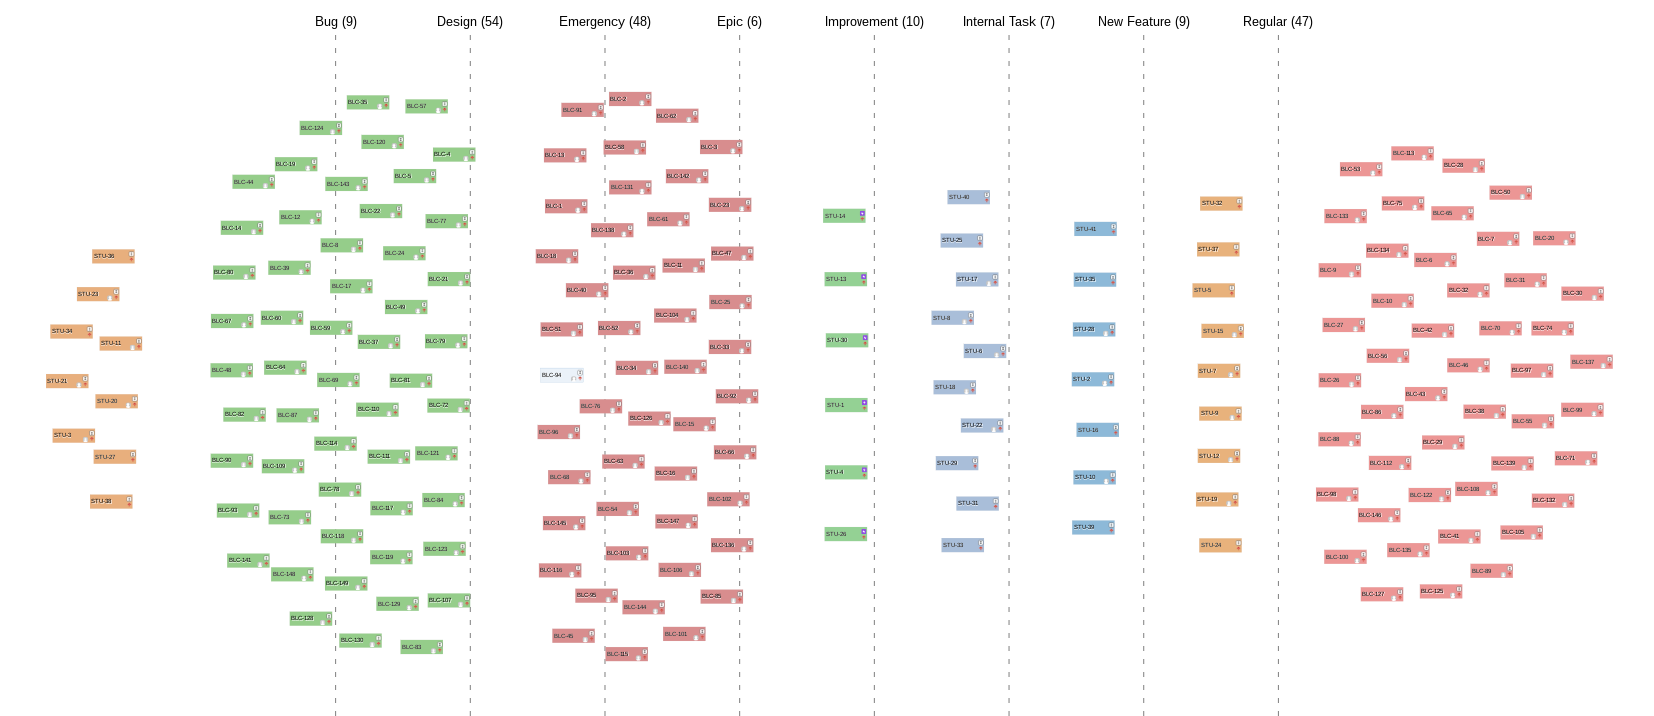
Social graph
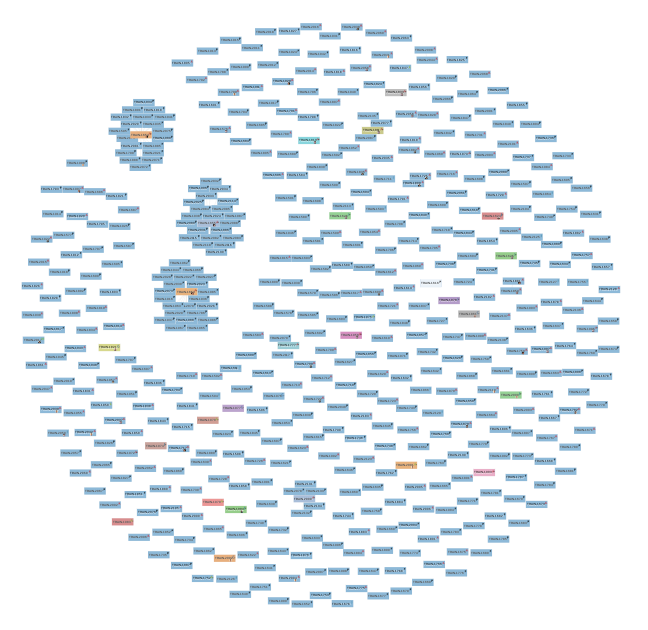
The social graph view will visualize where your major clusters lie. This view is only available when no X or Y axis fields are selected, and shows relationships best with combined multi-value fields.
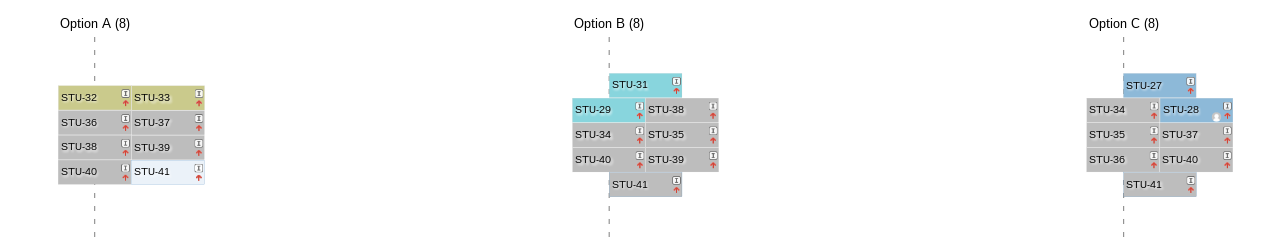
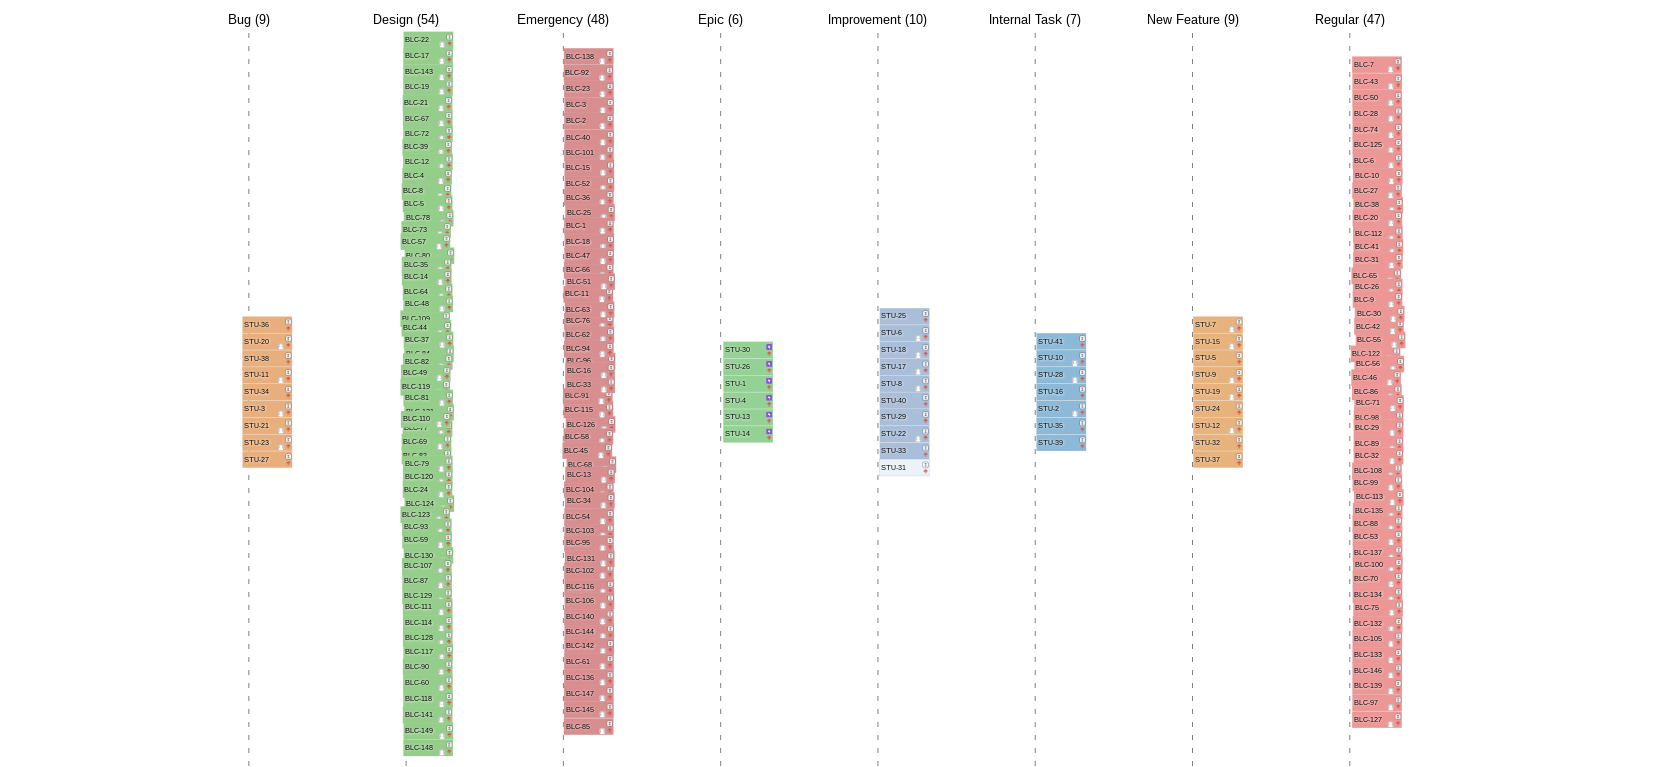
Vertical stack

The vertical stack view stacks your work items for easy comparison between X-axis values. This view is only available when an X-axis field is selected.
Advanced configuration
Visualizer is built on a popular physics emulator to produce a force-directed graph configurator, and as such, has a number of ways to adjust these physical properties. Tweaking these settings can lead to the discovery of different organically occurring patterns.
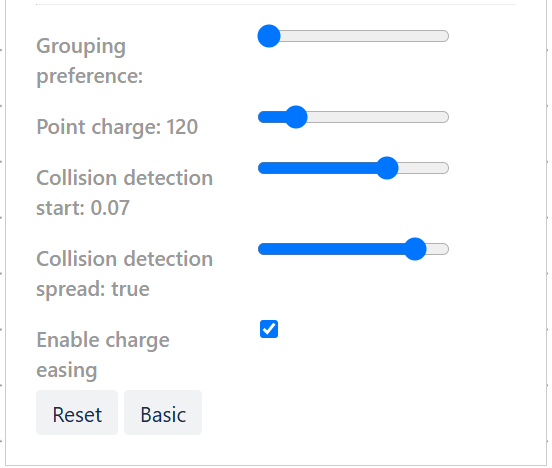
Grouping preference
The grouping preference control determines how linked work items in JIRA gravitate toward each other.
The farther left, the less the attraction.
By default grouping preference is weak, providing a visualization where items are primarily located at their intended coordinates with a slight hint of connection to other group members. Grouping preference is only active when Multi-value fields are combined.


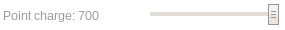
Point charge
Dust off your physics notes. Force-directed graphs work by naturally repelling items from each other. Point charge is how hard they push away. A higher point charge means more repulsion.
The father left, the less the repulsion. Completely left sets a point charge of zero. This setting is independent of collision detection.
By default, the point charge is weak, providing a trade-off between visual spacing and allowing items to group around their intended coordinates.

Collision detection start
Collision detection prevents cards from overlapping. Collision detection start determines how soon cards start “looking” for collisions on their way to their intended coordinates. If collision detection starts too early, the cards go wild and may not reach their ultimate destination, having given up after a number of attempts to move without colliding. If it starts too late, the cards may reach their destination, notice their overlap, and then explode outward, trying to avoid collision after the fact.
If the slider is all the way to the left, collision detection is disabled, i.e. it waits so long that it never starts. The farther right, the sooner the cards will detect collisions on their way to their intended coordinates.
Collision detection start is slow by default to allow a higher probability of the tiles reaching their intended coordinates, while still allowing them to undergo some collision detection.
Collision detection spread
Collision detection spread controls the strength of the repulsive force of collision detection, i.e. how vigorously a card will try to get away from its neighbour.
When set to the far left, cards will detect a collision, back up a little, and try again. To the far right, the cards will detect a collision and fling themselves as far away as possible. This setting is independent of Point charge.
Collision detection spread is fairly strong by default to allow a high probability of the titles reaching their intended coordinates, while still ensuring no overlap.
Enable charge easing
When enabled, once a card reaches its destination, its point charge will be reduced to zero. This establishes tight clustering around intersections. By enabling this setting and setting Collision detection start to zero, cards will overlap exactly.
Limitations
For performance reasons, the visualization only includes the first 500 work items matching the query.
Security
Visualizer does not update any data in Jira. Only read access is needed.
All queries are executed online as the currently logged-in user. Different users may see different results for the same query, depending on their access rights.